1 Exploring the microcosmos
1.1 Background
We live in a world dominated by microbial life. Accounting for bacteria and archaea (prokaryotes) alone, an estimated 1030 cells occupy the biosphere. For most of Earth’s history, this microcosmos has been driving matter and energy transformations through distributed networks of metabolite exchange resulting in global biogeochemical cycles and symbiotic interactions that create and sustain the conditions of multicellular existence, including our own.
Recent advances in high-throughput sequencing and mass spectrometry platforms have enabled us to develop more quantitative insights into these networks’ structure and function at the individual, population, and community levels of biological organization. The resulting data sets have revealed both incredible diversity and ecological resilience and provided an opportunity to develop predictive models and sustainable biotechnologies with the potential to transform the way humans interact with the natural world and one another.
Despite the power and the promise of this new perception, we exist dangerously close to upsetting the planetary boundaries that have promoted successful human expansion over the past 20,000 years. Global climate change is one manifestation of the cost we have paid in our pursuit of material and energy resources. Still, there are others, including biodiversity loss through habitat destruction, rampant pollution, and imbalances in integral element cycling of nitrogen and phosphorous.
Given the increasing availability of data sets describing microbial community structure and function in the world around us, we have an opportunity to learn from this information using bioinformatic tools and approaches. For this course, we will focus on one manifestation of climate change-related to dissolved oxygen (DO) loss in the ocean using a model ecosystem as a source of multi-omic (DNA and RNA) and geochemical parameter information over space and time.
Oxygen minimum zones (OMZs) are widespread areas of low DO in subsurface waters. Climate change resulting in increased stratification and reduced oxygen solubility in warming waters leads to OMZ expansion. Consequently, as oxygen levels decline, the microbial communities inhabiting OMZ waters shift their metabolisms to utilize alternative terminal electron acceptors. This shift results in the production of climate-active trace gases such as nitrous oxide (N2O) and methane (CH4).
Specifically, we will study the effects of changing oxygen levels on communities of bacteria and archaea inhabiting the Saanich Inlet water column. Saanich Inlet, situated on the coast of Vancouver Island, British Columbia, is a seasonally anoxic fjord that provides a biodynamic perspective on OMZ expansion. From a systems ecology perspective, OMZs provide useful environmental contexts in which to study coupled biogeochemical cycling through distributed metabolic networks, especially the integration of the carbon, nitrogen and sulphur cycles.
By combining multi-omics and geochemical parameter information from OMZs, it becomes possible to evaluate microbial communities’ regulatory and response dynamics to changing DO levels. For example, because OMZs are hotspots for nitrogen loss processes reconstructing the nitrogen cycle as a distributed metabolic process can shed new insight into microbial controls on matter and energy transformations integral to ocean health and climate balance. Genes encoding key steps in the nitrogen cycle are well defined (Figure 1.1), providing a basis for functional anchor screening to determine their distribution across the Tree of Life.
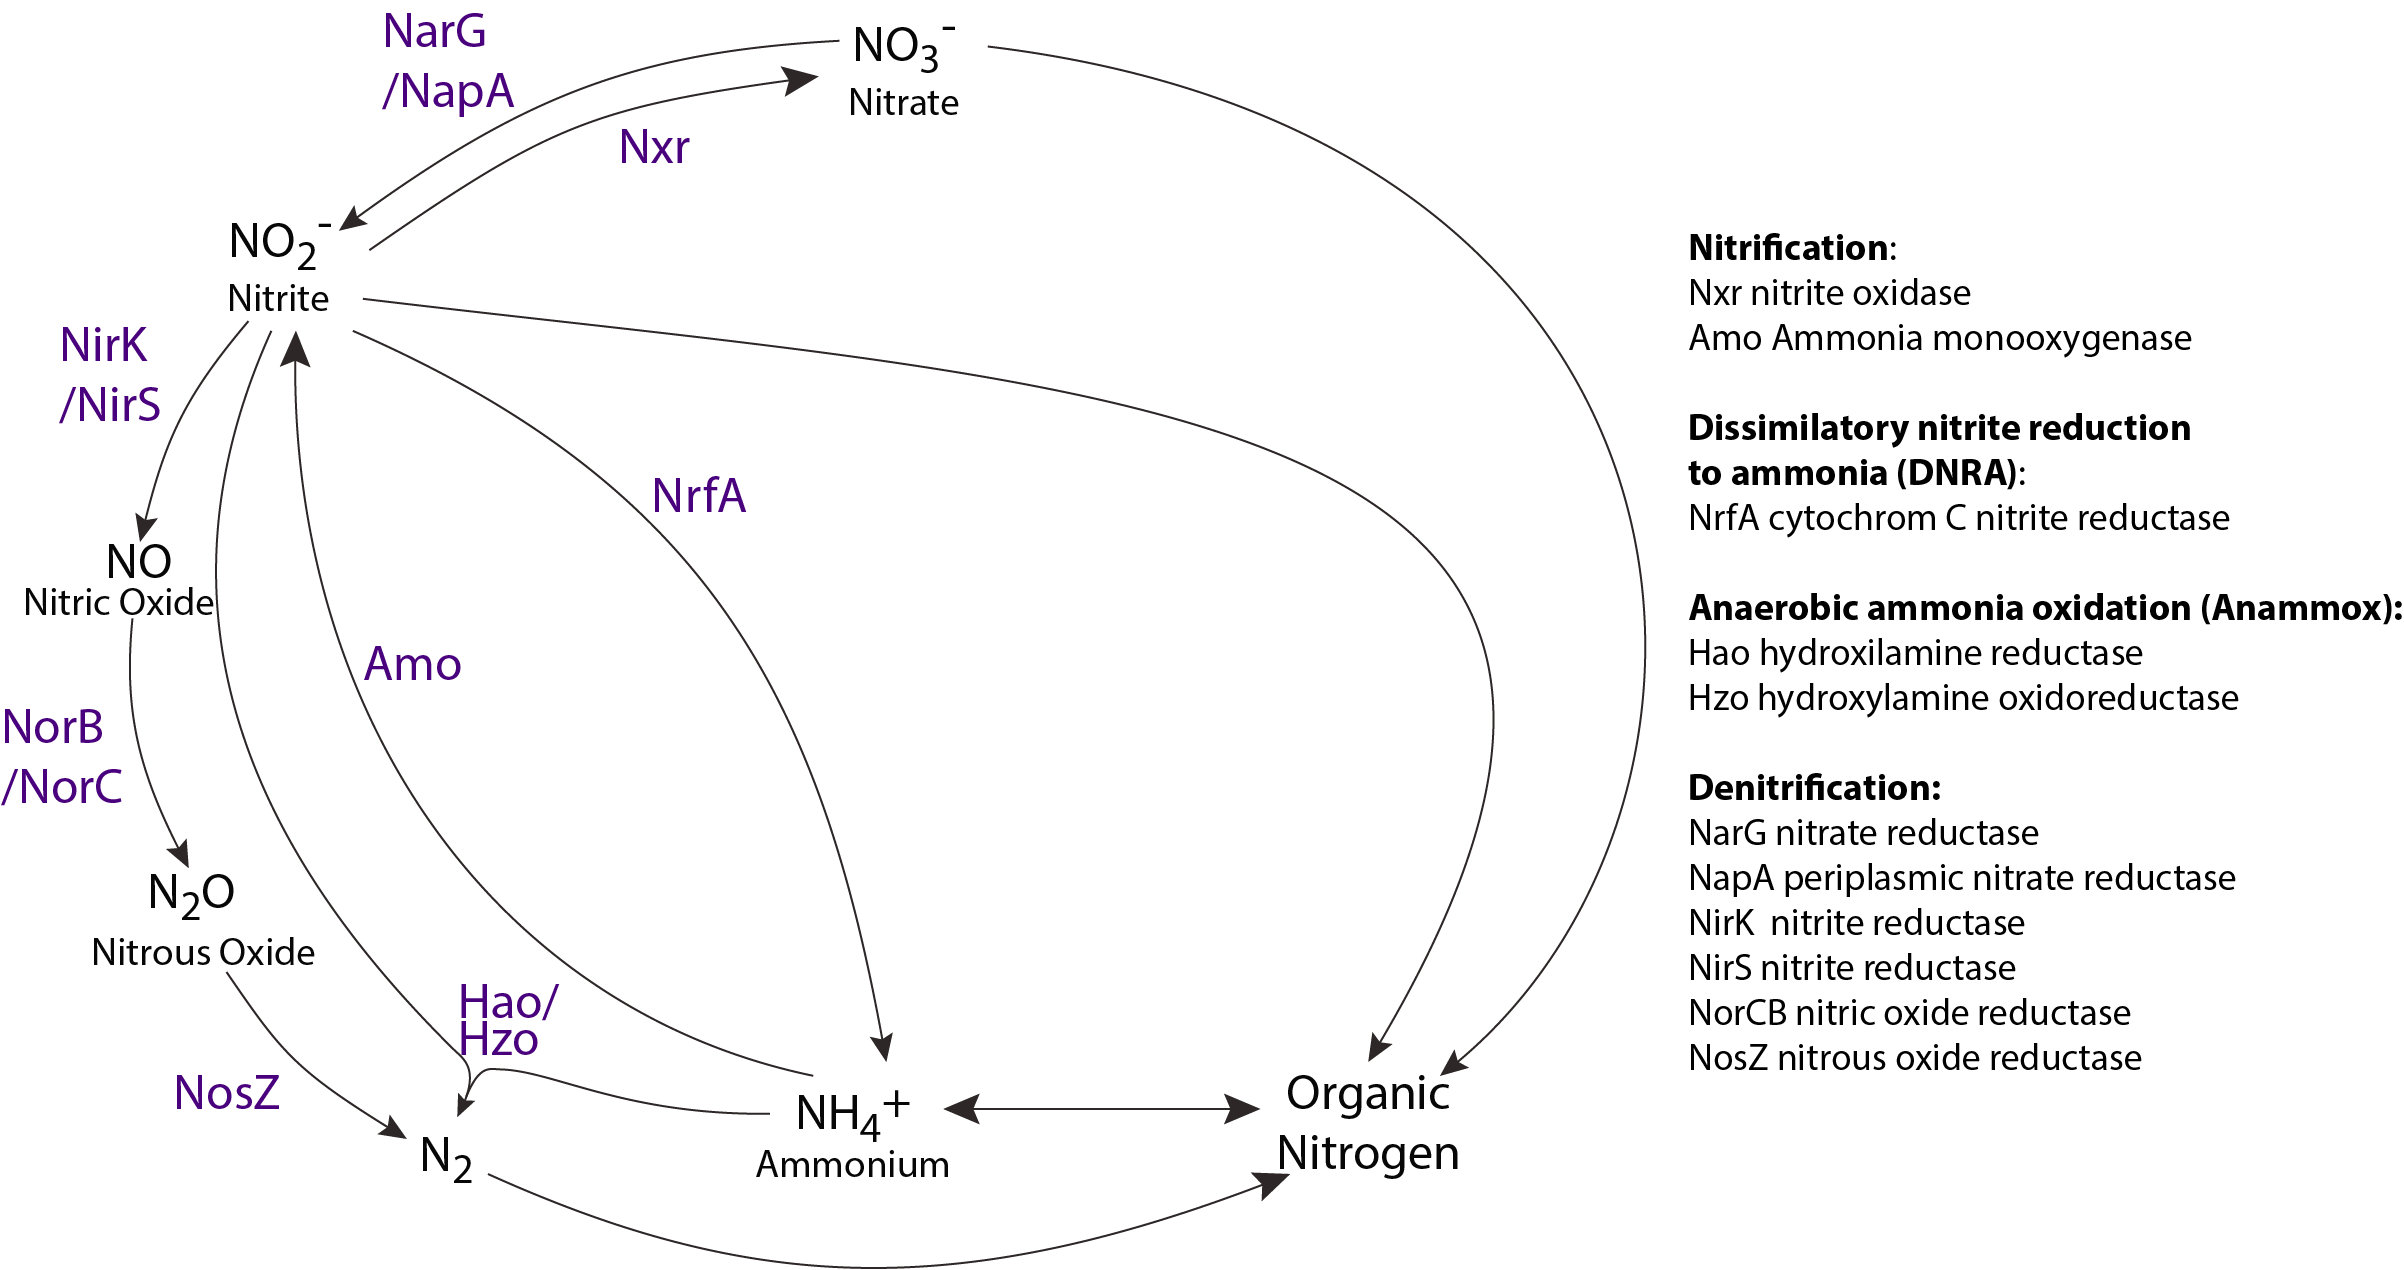
FIGURE 1.1: Nitrogen cycle
1.2 Using multi-omic data to reconstruct distributed networks of metabolite exchange
The nitrogen cycle is just one aspect of the distributed metabolic network that defines microbial interaction space. Throughout this capstone project, you will have the opportunity to explore this space using a gene-centric approach. This approach is based on identifying and quantifying phylogenetic or functional anchor genes that represent key microbial players and metabolic pathways in the system under study. In a big picture sense, we want to use these data to answer three foundational questions concerning microbial community structure and function: Who is there? What are they doing? How do they respond to change?
Biological information flow can be described as a process of converting genotypic information encoded in the DNA base pairs of the genome transcribed into RNA messages that are translated into proteins at the level of the ribosome. These proteins, in turn, go on to catalyze metabolic transformations and regulatory dynamics that ultimately give rise to phenotypic expression, adaptation and response. This flow of information is formally referred to as the Central Dogma of Biology.
Genomic sequence information provides a basis for determining the types of microorganisms present in a sample and inferring metabolic potential at the individual, population and community levels of biological organization. Because DNA can persist in the environment for longer than RNA or protein, we can also use the abundance of gene X or gene Y to tell us about prior metabolic activity, e.g. gene abundance is a proxy for the process. We can use gene abundance information in numerical models to infer metabolic flux through a given pathway because the abundance of gene X is proportional to genome replication in which it resides. Genomic information is also more robust to sampling noise as we collect and process samples for downstream analysis. For information on gene-centric modelling incorporating DNA, RNA and protein information in Saanich Inlet, see this paper (1).
While genomic information tells us about metabolic potential, the transcriptome guides action or gene expression. To a certain extent, we can use this information to identify who is there, but more often, to indicate which pathways are active at the time of sampling. Transcriptomic data can open a window into response patterns along environmental gradients with the caveat that its short-lived nature is less robust to sampling noise. The presence of transcripts for a given gene X is no guarantee for their conversion into protein. However, because prokaryotes couple transcription to translation, we typically infer a direct relationship. For information on relationships between DNA, RNA and protein in Saanich Inlet, see this paper as well (2).
1.3 TreeSAPP
For this project, you will be implementing a software application called Tree-based Sensitive and Accurate Protein Profiler (TreeSAPP) (3). Given the current set of reference packages available, you are in a position to reconstruct key steps in selected biogeochemical cycles, e.g. carbon, nitrogen or sulphur, along defined redox gradients in Saanich Inlet. TreeSAPP takes either metagenomic or metatranscriptomic reads and aligns them to reference packages representing phylogenetic or functional anchor genes of interest. These reference packages are constructed from trusted sources and consist of a phylogenetic tree, multiple sequence alignment, hidden Markov model and taxonomic lineage information. Reference packages can be updated and refined as new sequence information becomes available, including isolate reference genomes, metagenome-assembled genomes (MAGs) and single-cell amplified genomes (SAGs), thereby improving the precision of taxonomic placement. TreeSAPP outputs can be readily visualized using the interactive Tree of Life (iTOL) (4) or plotted in R to make beautiful and informative data visualization products.